Equip your team with AI Analysts
Wobby’s AI Analysts deliver business-ready insights straight from your data warehouse, right in Slack or Teams. Self-serve analytics, trusted results.


Two teams.
Full alignment.
For data teams
Your rules. Your logic. Your control.


For business teams
Ask freely. Act faster.


The fastest way to get answers from your data

Operating System for
Agentic BI
Wobby lets you deploy AI analysts on top of your data warehouse and semantic layer—so your business teams can query data, get insights, and generate charts using natural language.

Wobby only uses structured, governed data directly from your data warehouse.
Designed for reliability, not experimentation.
Instant answers drop straight into Slack & Teams channels you already use—no extra tabs, no context-switch.
Answers show up where your team already works.

Plugs into your data catalog to keep definitions aligned and answers predictable.
Knows your business definitions — not just your data — by integrating with your data catalog.

Your data team sets the rules and signs off query templates—then tracks who asked what and when, down to every JOIN.
Your logic, your rules, no surprises.

Your data stays where it's stored while Wobby brings the answers to you.
Queries your warehouse directly, nothing exported.
Only storing small samples for better accuracy, but can be disabled

Approved queries become smarter templates with every run.
Your data team's queries become templates Wobby reuses and refines, delivering faster and more reliable answers.

Why your team needs Wobby?

How it works.
Zero-copy connection to your existing data (BigQuery, MS SQL, etc.).
Wobby reads your tables, columns, and definitions.
Business users speak human. Wobby translates.
SQL, charts, summaries — explained, logged, auditable.
Built-in validation. Version control. Role-based access. Governance isn’t optional: it’s the foundation.
Trusted by leaders

Wobby opens the black box for us. Before, our data was locked away - we had dashboards showing numbers, but we couldn't dig deeper to understand what was really happening behind those metrics.
Now, instead of just seeing 'new users' as a number on a dashboard, I can ask: Who are these users? What professions do they have? Which ones actually started contracts? Wobby doesn't just give me the data - it helps me think about the right questions to ask.

Information today is about being accurate and fast. Wobby really helped us with both. For the Belgian elections, Wobby helped us create data-driven content at scale. We reached new readers thanks to this.
With Wobby, we at Becom, Belgium's leading federation for e-commerce and digital businesses, can finally make better sense of our own data. It helps us not only tell clearer stories but also makes it easy to create reports at scale.

What teams ask. And how Wobby answers.


Steve got his results 2 days later — after exporting a CSV, then chasing down clarification in a Slack thread.
Patrick waited 2 days — chasing updates across emails and outdated pipeline reports.
Alice got answers a week later — after pulling data manually from three different systems.
Lisa had to wait days — as Finance double-checked spreadsheets and reconciled numbers.
Nathan waited hours — juggling multiple tools to piece together ticket data.
Timothy got his results 2 days later — after exporting a CSV, then chasing down clarification in a Slack thread.


Wobby jumps in instantly — no waiting, no back-and-forth.
Wobby delivers answers instantly — no bottlenecks, no chasing.
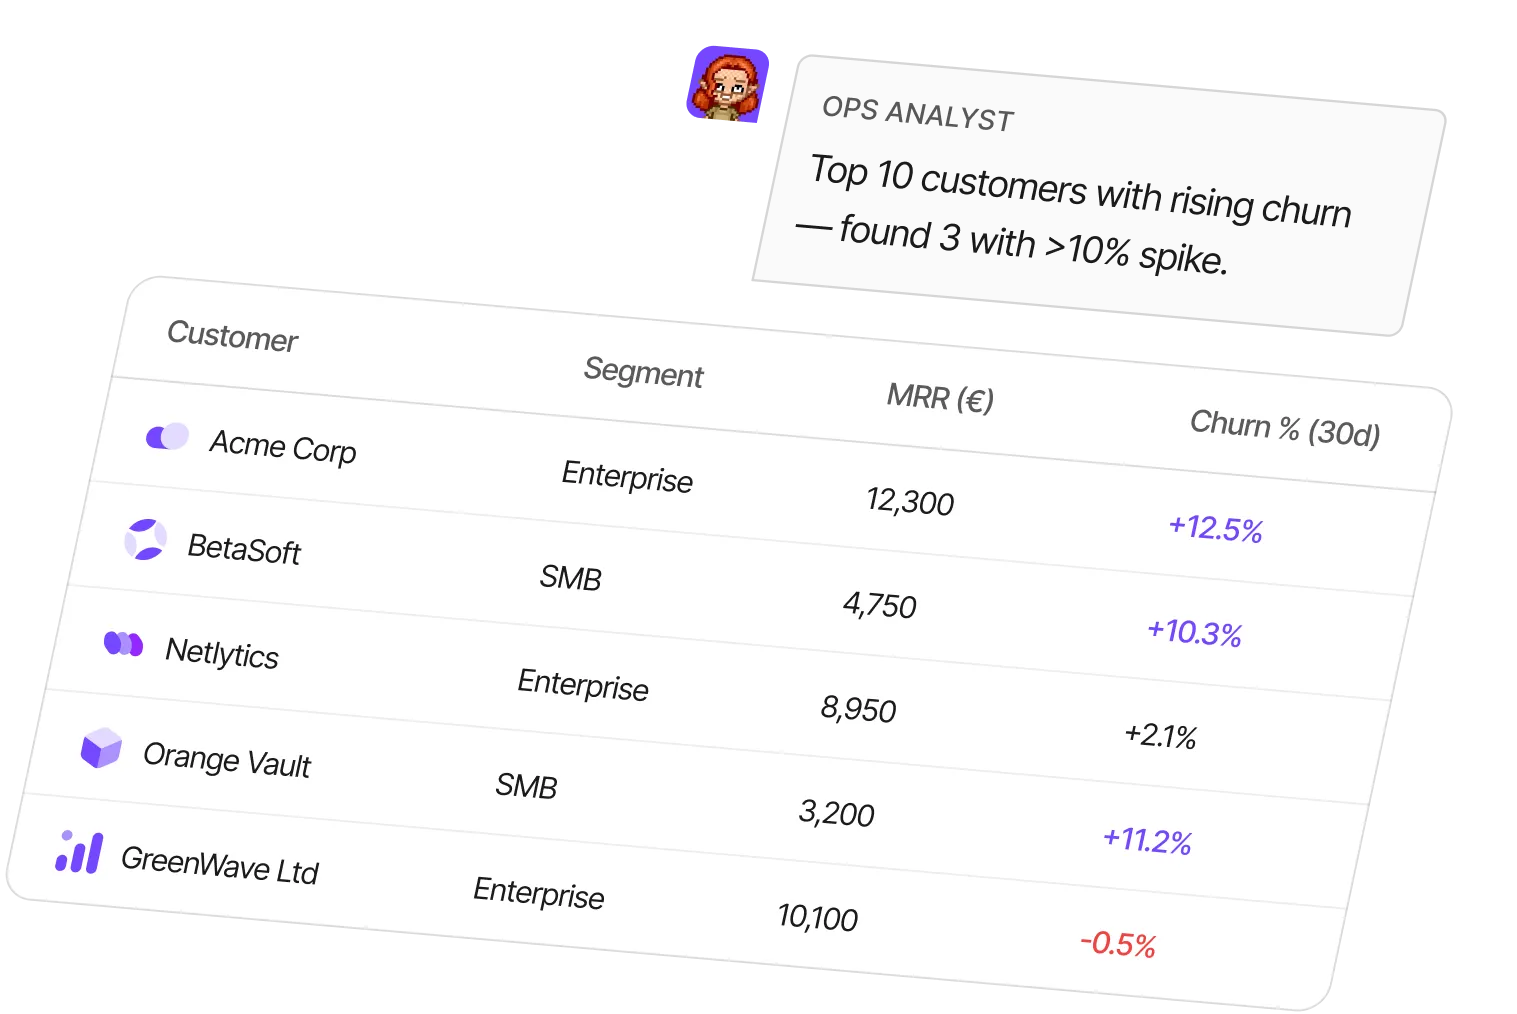
Wobby gives Ops instant visibility — problems spotted before they grow.
Wobby brings financial clarity immediately — no surprises at month-end.
Wobby speeds up customer insights — happier teams, happier customers.
Wobby frees analytics from grunt work — more time for real impact.
Natural language interface
Ask in Slack or Teams. No filters, no tools to learn.

Governed query templates
Your team defines what’s possible: no free-for-all.

Full validation before delivery
No hallucinations. No surprises.

Zero-copy, secure architecture
Query where your data lives. No duplication.

Powered by your logic
Deploy AI analysts trained on your documentation, metrics, and catalog

Real-time answers in real workflows
No need to switch tabs or tools.


