As an insights analyst at Wobby, I get to dig into all kinds of interesting data. One dataset I looked at recently was on VAT-liable companies in Belgium from Statbel – “Monthly Evolution of VAT-Liable Companies by NACE Category in Belgium (2001-2023)”.
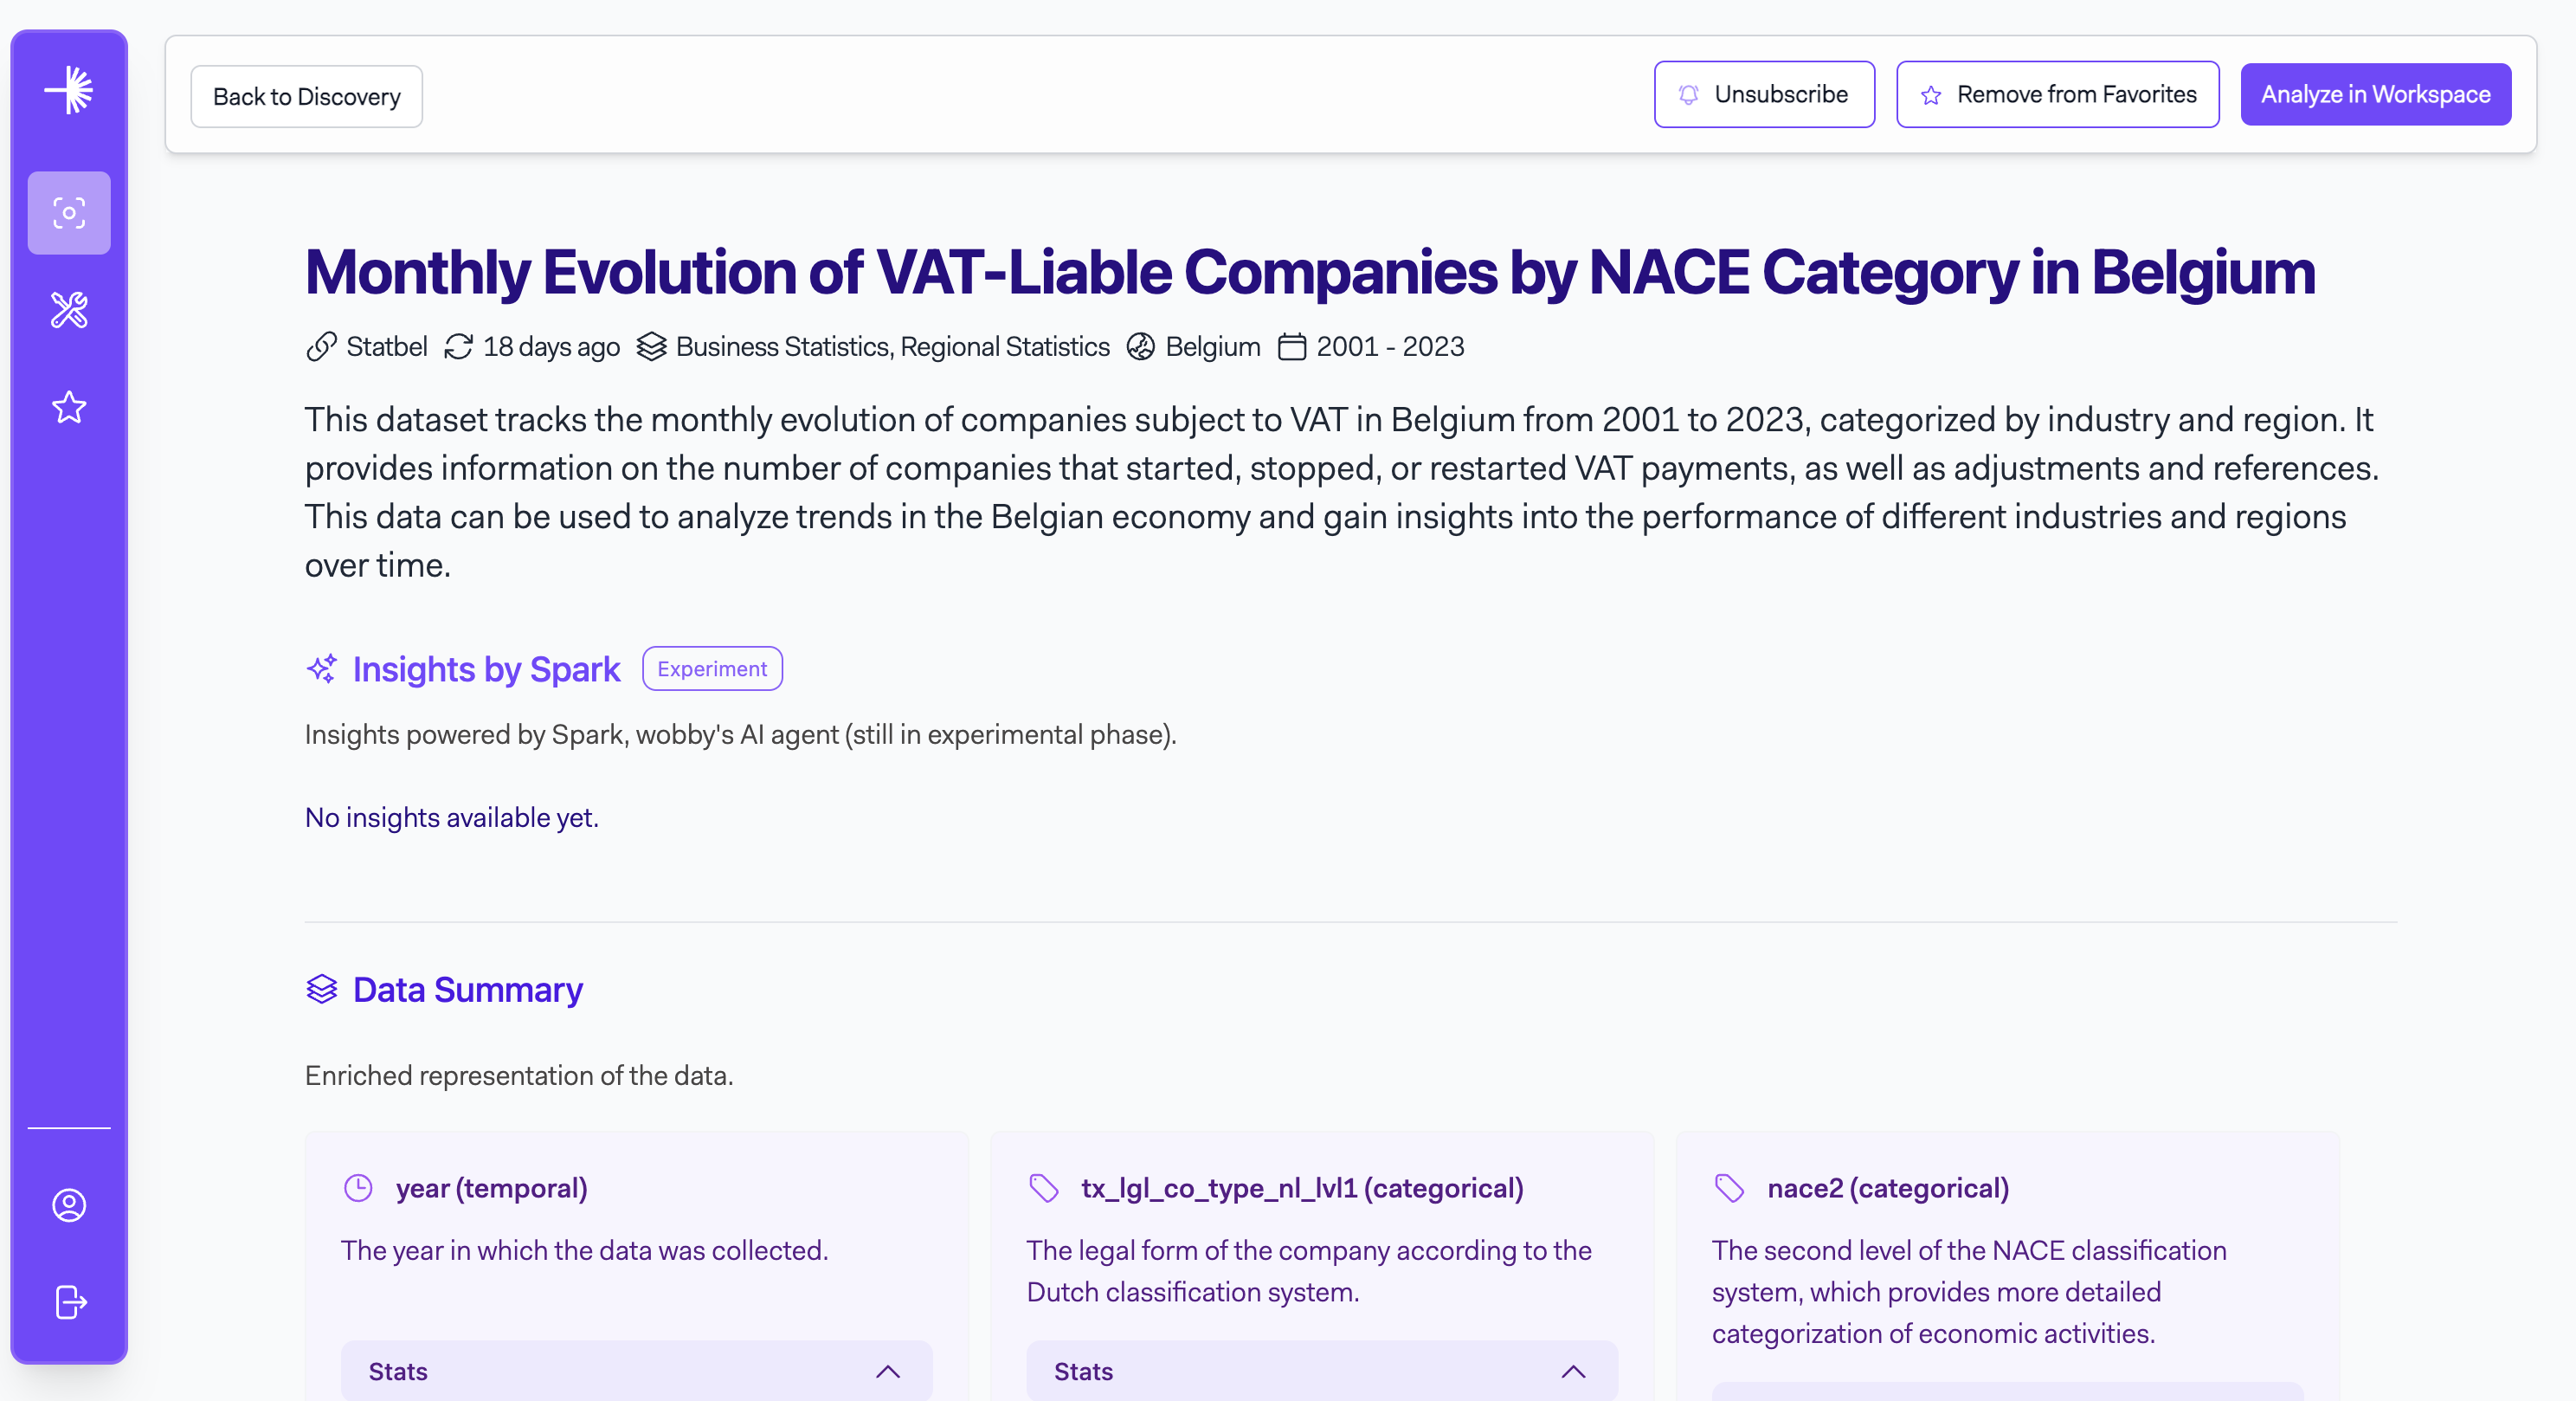
This tracks new companies, closures, restarts and more each month across sectors and regions from 2001-2023. Perfect for spotting trends in the Belgian economy!
I was curious – how have company formations and closures changed monthly over the last few years?
After opening the dataset in Wobby’s workspace, I decided to look at new company formations vs closures per month from 2021-2023. Using Wobby’s natural language interface, I simply asked:
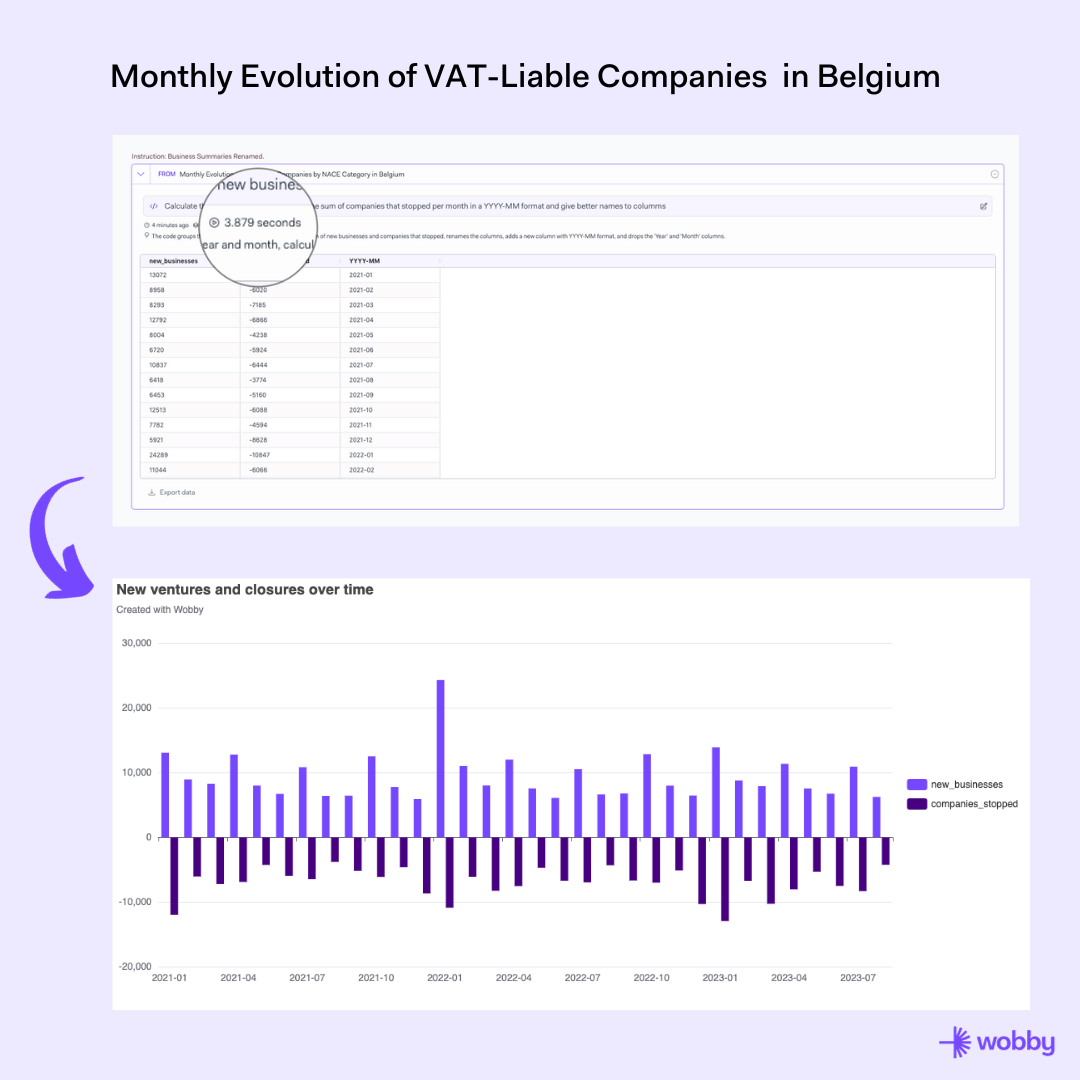
“Calculate the sum of new businesses and the sum of companies that stopped per month in a YYYY-MM format.”
In just seconds, Wobby generated this new formatted dataset for me. I then easily created a bar chart visualization to compare new companies and closures over time. The chart revealed some intriguing patterns: new IT company registrations spiked in mid-2022! Meanwhile, construction closures rose steadily.
The best part is this analysis is now saved. When new data comes in, Wobby will automatically update my charts with the latest numbers. No need to manually redo work!