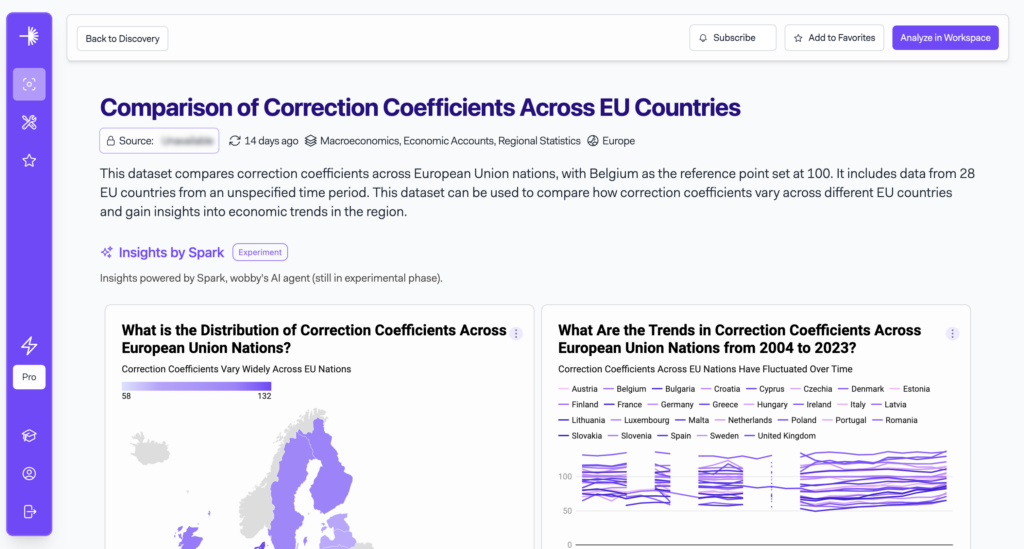
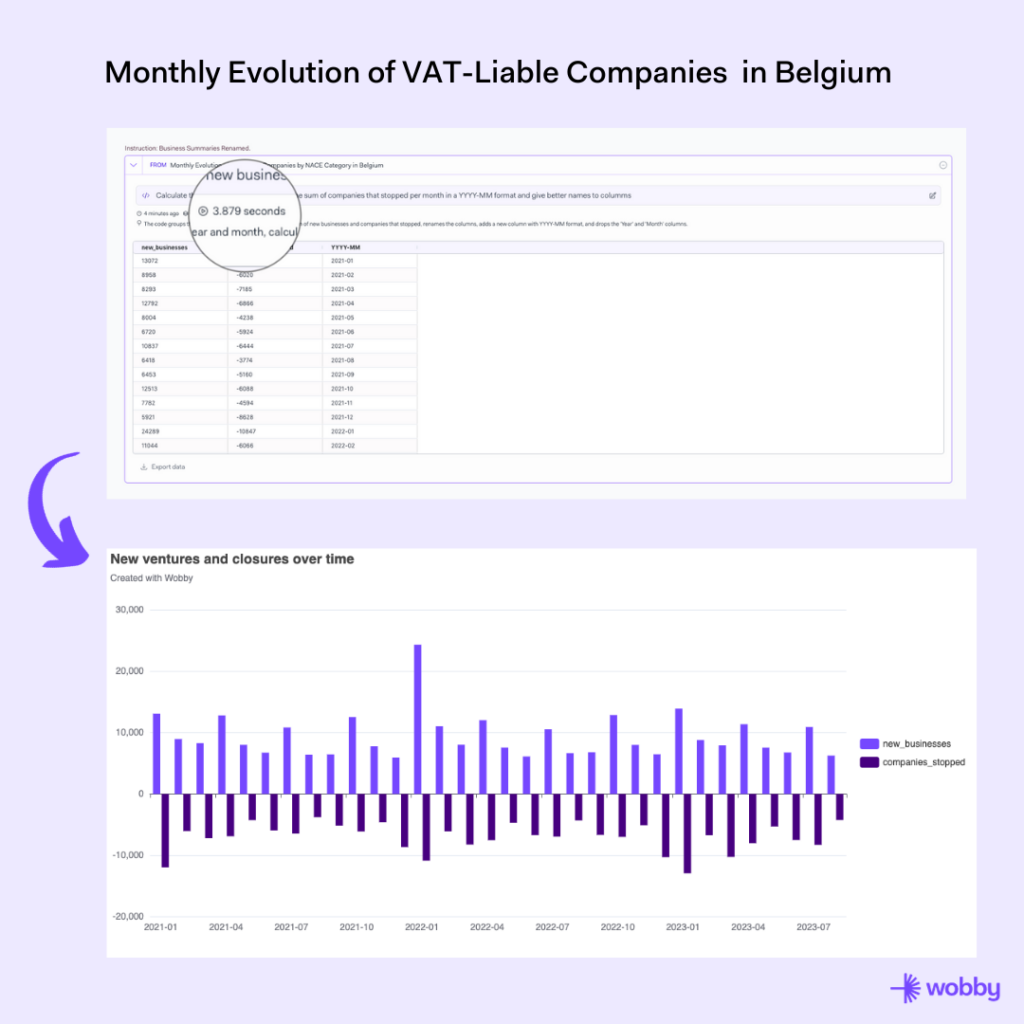
We’re excited to share some new updates to help you get even more value out of Wobby. We’ve added 8 new visualization options – like pie charts, maps, and scatter plots – plus color palettes and legends to make your data really stand out. These new interactive charts will help you better understand and present […]
Wobby Featured in Trends Magazine
Hi everyone! We’re excited to announce that Wobby was recently featured in Trends Magazine in Belgium! Wobby began as a platform to help journalists turn complex data into engaging stories. In under a year, we’ve been amazed to see journalists actively embracing Wobby. Their feedback has been invaluable, driving us to continually refine and enhance […]
New Workspace feature ‘Transform’ makes data analysis 10x easier!
I hope you had great holidays! Our team at Wobby wishes you a bright 2024! As we step into the new year, I have an exciting new Wobby feature to share with you! New Workspace Feature: âTransformâ step We just rolled out a new feature in Wobbyâs Workspace that makes analyzing data much faster and […]
We Made It to ‘De Journalist’ magazine!
Hi everyone! Today, we’re thrilled to share some exciting news: Wobby has been featured in the latest edition of “De Journalist” magazine. This is more than just a media mention for us; it’s a milestone in our journey. Wobby began as a platform to help journalists turn complex data into engaging stories. In under a […]
The Gender Pay Gap in the Netherlands
Hey everyone! Today Iâm going to analyze the âEarnings Gap between Men and Women in Various Sectors in the Netherlandsâ dataset that I found on Wobby. As a policymaker, journalist, advocate, or anyone interested in workplace equity, you may want to examine the latest statistics on the gender pay gap between men and women across […]
How I discovered where It’s Cheaper vs. Costlier to Live in the EU
Hey everyone, it’s Marie here. Today I’m going to analyze the “Comparison of Correction Coefficients Across EU Countries” dataset that I found on Wobby. If you are researching standards of living across Europe, you might come across the this dataset on Wobby. This dataset tracks correction coefficients for 28 EU nations from 2004 to early […]
Gaining Insights into Belgian Business Trends with Wobby
As an insights analyst at Wobby, I get to dig into all kinds of interesting data. One dataset I looked at recently was on VAT-liable companies in Belgium from Statbel – “Monthly Evolution of VAT-Liable Companies by NACE Category in Belgium (2001-2023)”. This tracks new companies, closures, restarts and more each month across sectors and regions […]